
Poverty Rate for the Hispanic Population Fell to 13.9%, Lowest on Record
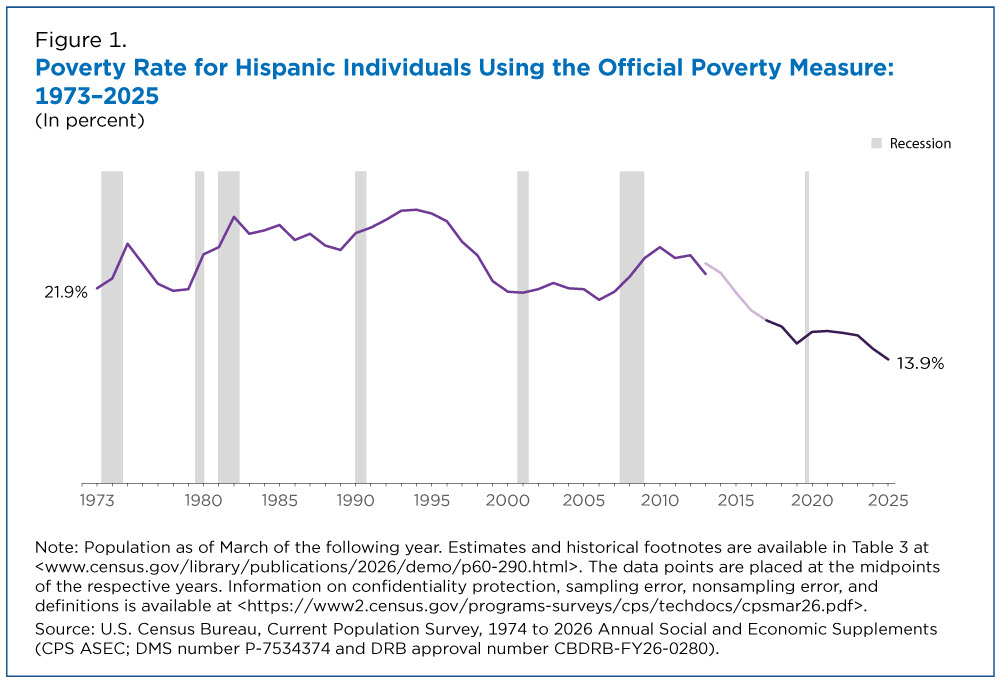
The official poverty rate of the U.S. Hispanic population fell to a historic low of 13.9% in 2025, according to the U.S. Census Bureau’s Poverty in the United States: 2025 report released today.
Estimates from the Current Population Survey Annual Social and Economic Supplement (CPS ASEC) show that the Hispanic poverty rate fell 1.2 percentage points between 2024 and 2025.
The 2025 Hispanic poverty rate fell to a record low even after accounting for survey and methodological changes to the CPS ASEC, the Census Bureau’s longest-running survey.
The official poverty rate for the nation also dropped to 10.2% from 10.7% in 2024.
The official poverty measure defines poverty by comparing pretax money income to a national poverty threshold adjusted by family size, number of children and age of householder.
The 2025 Hispanic poverty rate fell to a record low even after accounting for survey and methodological changes to the CPS ASEC, the Census Bureau’s longest-running survey.
Figure 1 charts historic official poverty rates for the Hispanic population back to 1973, the first year the CPS ASEC collected information on the Hispanic population. In 1973, the official poverty rate for Hispanic individuals (of any race) was 21.9%.
Hispanic Population Still Overrepresented in Poverty Population
Despite the overall decline in the Hispanic poverty rate, Hispanic individuals still made up a larger share of the population in poverty than the overall population.
Figure 2 shows the composition of the overall population and the population in poverty by race and Hispanic origin groups. Comparing a group’s share of the poverty population to its share of the total population shows whether its members are underrepresented or overrepresented in poverty.
Groups with a ratio of less than 1.0 are underrepresented (their share in poverty is lower than their share of the population), while groups with ratios greater than 1.0 are overrepresented (their share in poverty is higher than their share of the population).
Hispanic individuals made up 28.1% of the population in poverty in 2025, but only 20.7% of the total population. This results in a ratio of 1.4 — an overrepresentation of the Hispanic population in poverty.
The Black (ratio of 1.7) and American Indian and Alaska Native or AIAN (ratio of 1.6) populations were also overrepresented in poverty in 2025. Ratios for the Black and AIAN populations were not significantly different from one another.
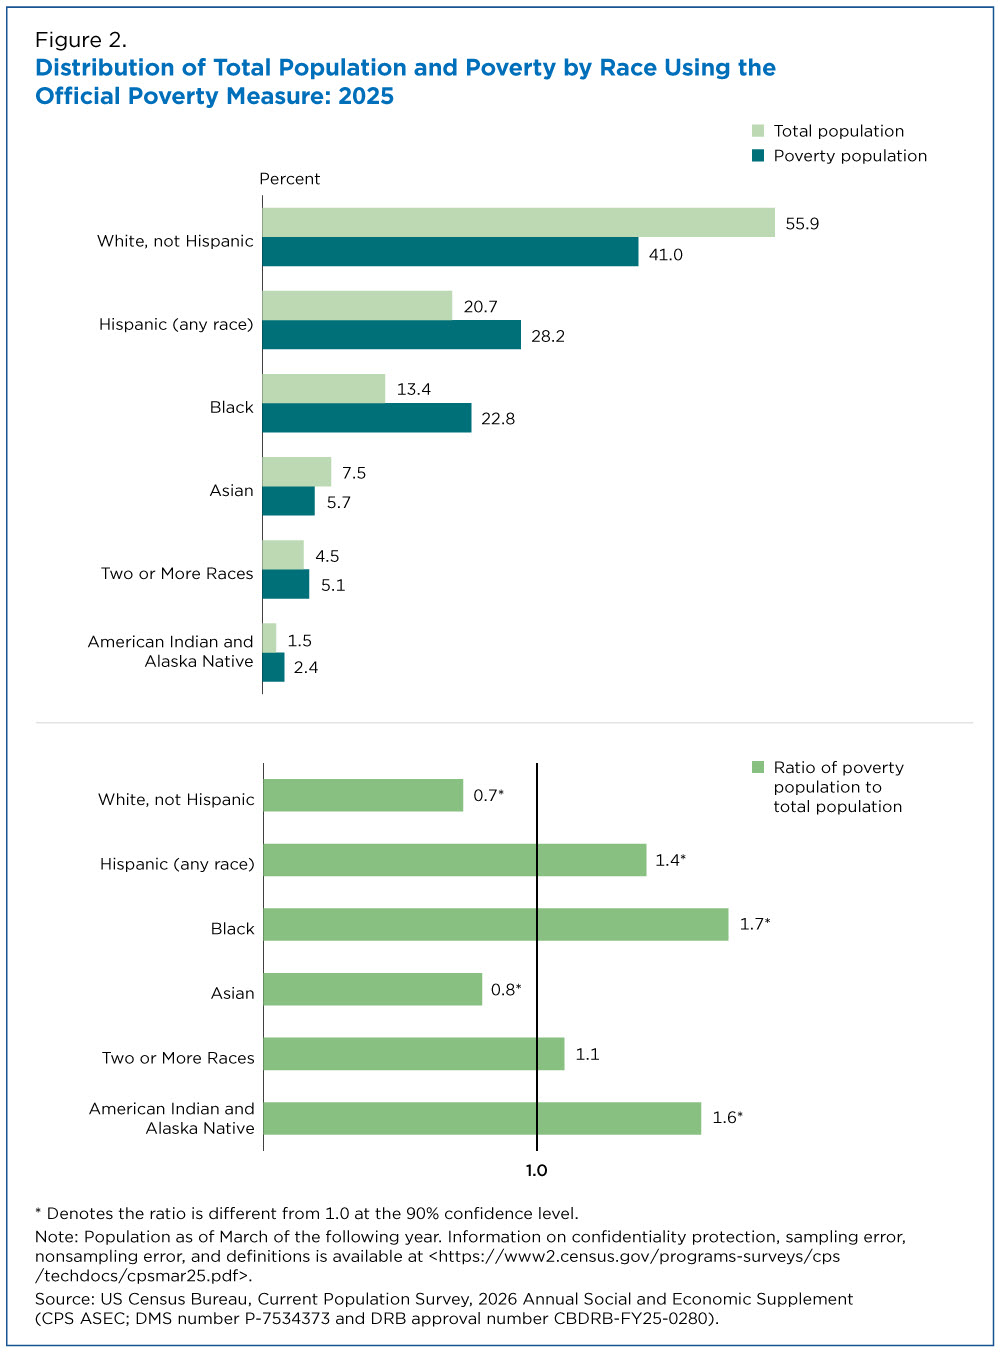
Non-Hispanic White (ratio of 0.7) and Asian (ratio of 0.8) individuals were underrepresented in poverty in 2025. These ratios also weren’t significantly different from one another.
The ratio for the Two or More Races population (1.1) was not significantly different from 1.0, meaning that this group was neither overrepresented nor underrepresented in poverty.
About the CPS ASEC
CPS ASEC data are released annually in September and are the source for the official poverty measure. The CPS ASEC collects data on income, health insurance, government benefits, migration and childcare.
The Poverty in the United States: 2025 report and accompanying data tables contain more information on poverty estimates and provide poverty estimates for several demographic groups and family types.
The technical documentation page includes information on confidentiality protection, methodology, and sampling and nonsampling error. All comparative statements have undergone statistical testing and are statistically significant at the 90% confidence level unless otherwise noted.
Related Statistics
Subscribe
Our email newsletter is sent out on the day we publish a story. Get an alert directly in your inbox to read, share and blog about our newest stories.
Contact our Public Information Office for media inquiries or interviews.
Related America Counts Stories
-
IncomeU.S. Real Median Household Income Reached Record High in 2025September 15, 2026Real income increased at the top but not the bottom of the income distribution from 2024 to 2025.
-
Income and PovertySupplemental Poverty Rate Tops Official Rate in 26 States, DCSeptember 15, 2026Louisiana had among the nation’s highest poverty rates by both the official poverty measure and the Supplemental Poverty Measure.
-
Health InsuranceMedicaid Coverage Declined in 2025 for Second Year in a RowSeptember 15, 2026Changes in policy, funding, eligibility and enrollment processes that began in 2020 contributed to decline in Medicaid coverage.
-
Income and PovertySupplemental Poverty Rate Tops Official Rate in 26 States, DCSeptember 15, 2026Louisiana had among the nation’s highest poverty rates by both the official poverty measure and the Supplemental Poverty Measure.
-
Income and PovertyHispanic Poverty Rate Reached Historic Low in 2025September 15, 2026The Hispanic population’s poverty rate fell to 13.9%, down 1.2 percentage points from 2024 — still disproportionately high despite being the lowest on record.
-
Health InsuranceMedicaid Coverage Declined in 2025 for Second Year in a RowSeptember 15, 2026Changes in policy, funding, eligibility and enrollment processes that began in 2020 contributed to decline in Medicaid coverage.
-
IncomeU.S. Real Median Household Income Reached Record High in 2025September 15, 2026Real income increased at the top but not the bottom of the income distribution from 2024 to 2025.